
This is how you get the numbers from your Klaviyo account into your Power Bi and Excel reports via the API.
In this short tutorial you will learn how to get Klaviyo metrics into your Power Bi or Excel dashboards via the Klaviyo API. One way to do this is to use Power Query. The whole thing is super exciting because
- you can also show things like customer retention or newsletter performance in your reports
- your reports are automated and can be updated with one click or a routine (without downloading annoying CSV files).
1 | Get your Klaviyo API Key
In the Klaviyo interface you can find all API Keys at: https://www.klaviyo.com/settings/account/api-keys. Of course you have to be logged in to access the URL. Furthermore, special rights might be required to create and view API Keys. In case of problems contact your account admin.
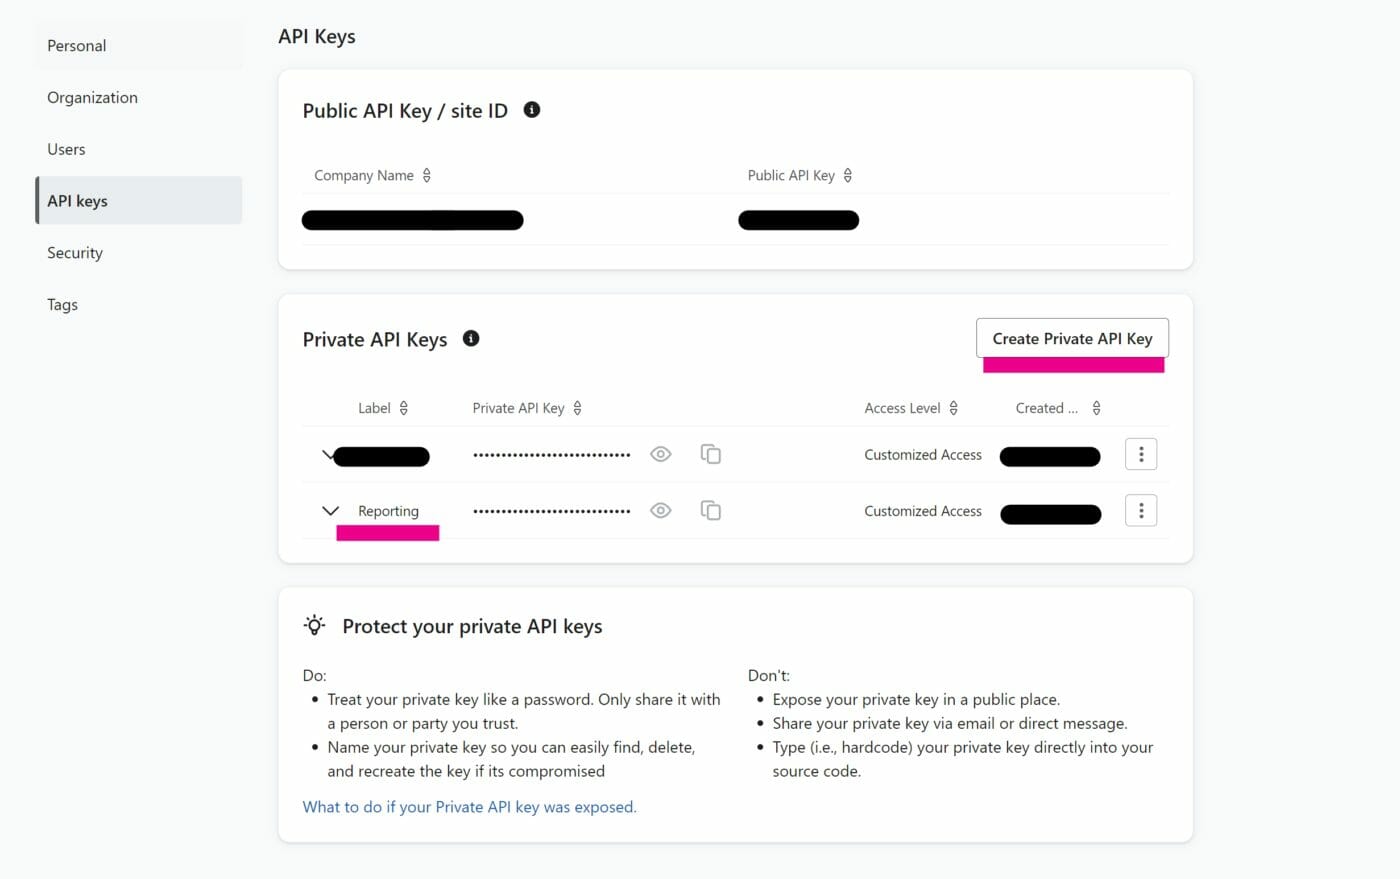
Create a special API key with “read only” rights for reporting purposes.
2 | Lookup your metrics IDs
Depending on which metric you want to use for your report, you need to know the corresponding metric ID from the Klaviyo system. In Klaviyo, metrics IDs are mostly six-digit combinations of lower and upper case letters as well as numeric characters. You can get a list of metrics for your account via the Get Metrics endpoint with a GET request.
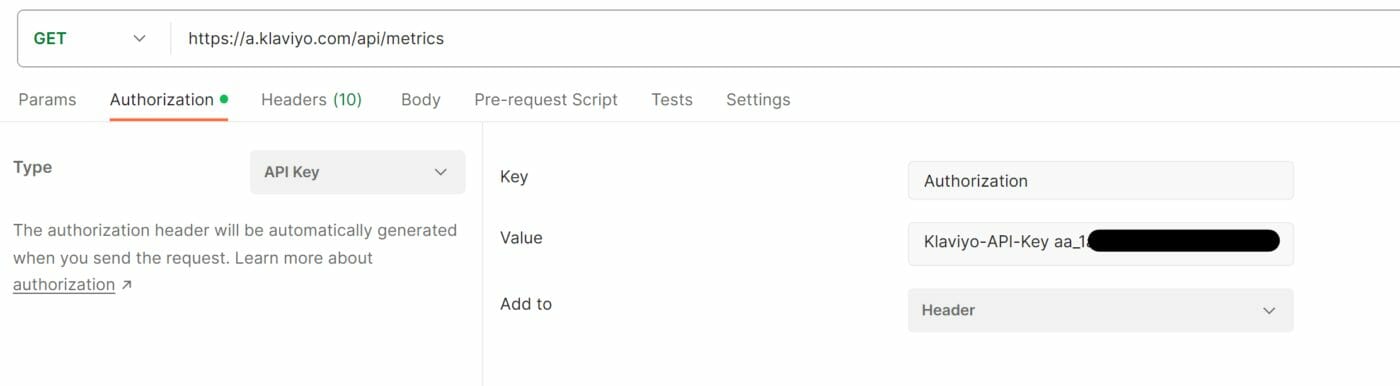
Since you don’t need the data from the response for further reporting, you can simply make the request in Postman Desktop or Power Automate Desktop. Long story short, the request that gives you the overview of your metrics IDs looks like this (in Postman):

The associated authorization is configured as follows (note the space between the Klaviyo API key prefix and the actual API key):
This is how the request looks in its raw version:
GET /api/metrics HTTP/1.1
Revision: 2023-07-15
Accept: application/json
Content-Type: application/json
Authorization: Klaviyo-API-Key pk_1aa111a...

Host: a.klaviyo.com
Accept-Encoding: gzip, deflate, br
Connection: keep-alive
The response you will recieve from the server looks something like this:
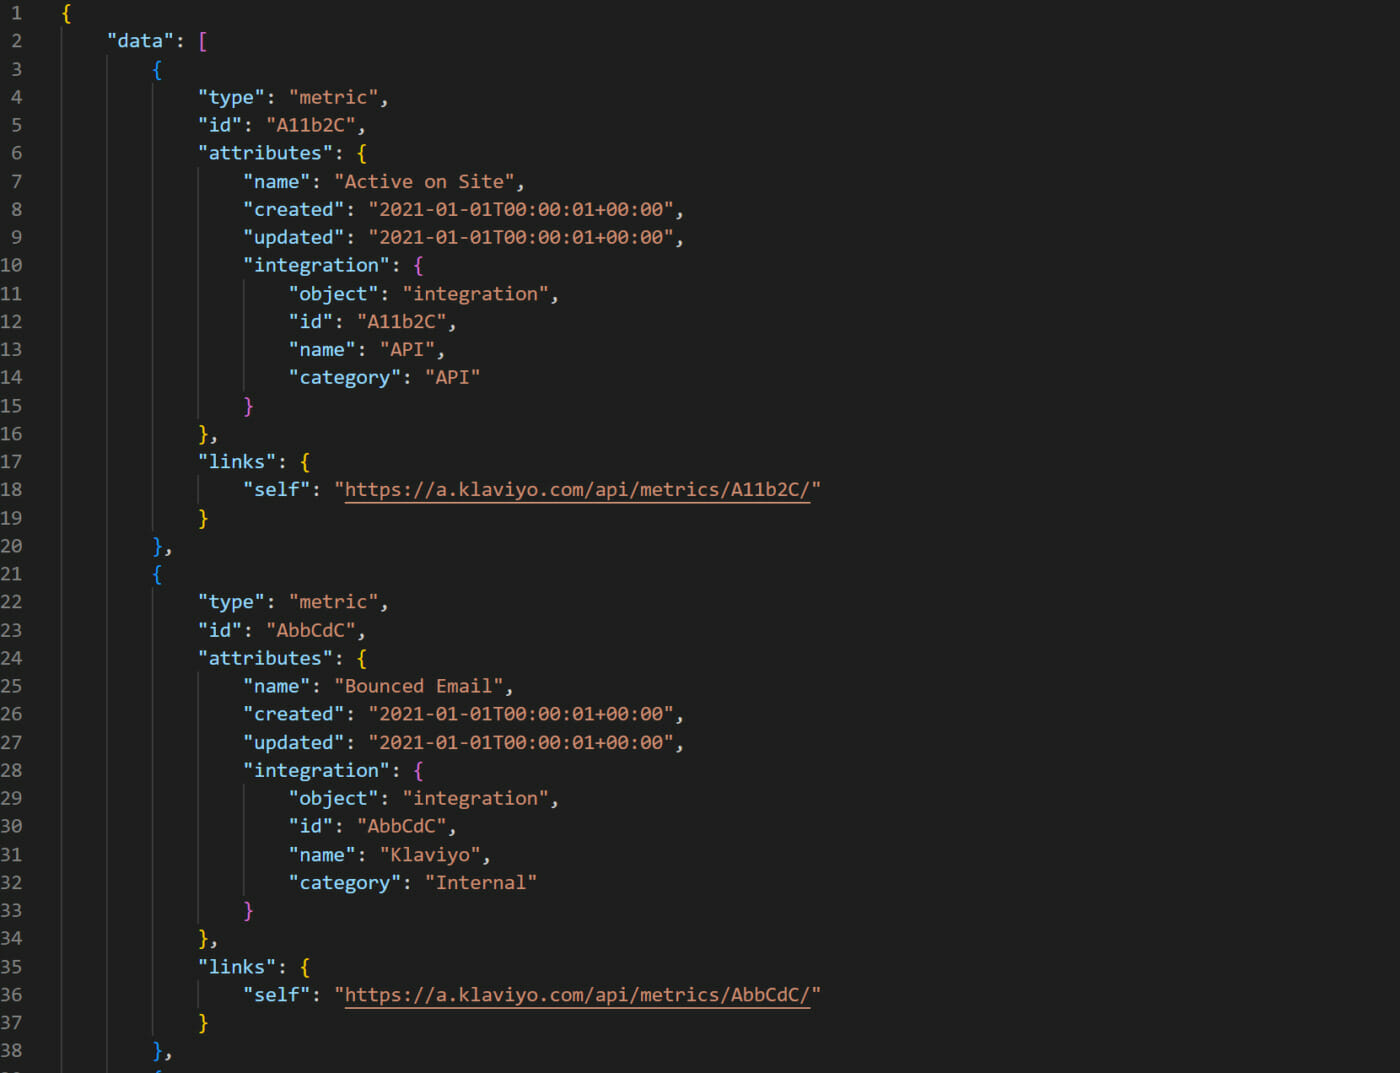
Find the metric you are looking for and copy the metric ID. In this case, for example, the metric for Bounced Email would have the ID AbbCdC (the ID has been changed for this example).
3 | Get your report via the Klaviyo API
To get the data for the metric you are looking for, you now need the Query Metrics Aggregate endpoint of the Klaviyo API.
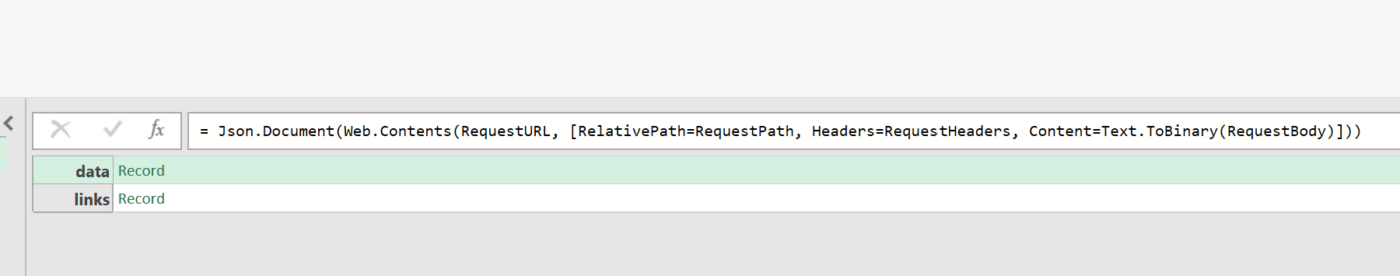
Open Excel or Power Bi and open the Power Query Editor (e.g. via Get Data) and create a blank query. The goal is to use the functions
- Web.Contents() and
- Json.Document()
to create a POST request to the Klaviyo API, which will return a JSON body as response. Since the whole thing is super wonky, I created a separate post on this, which can be found here: Klaviyo API POST Request in POwer Query (Power Bi, Excel).
In short: the M-Code in Power Query should end up looking something like this (with a mega long and complex body). See the above post for info on the body.
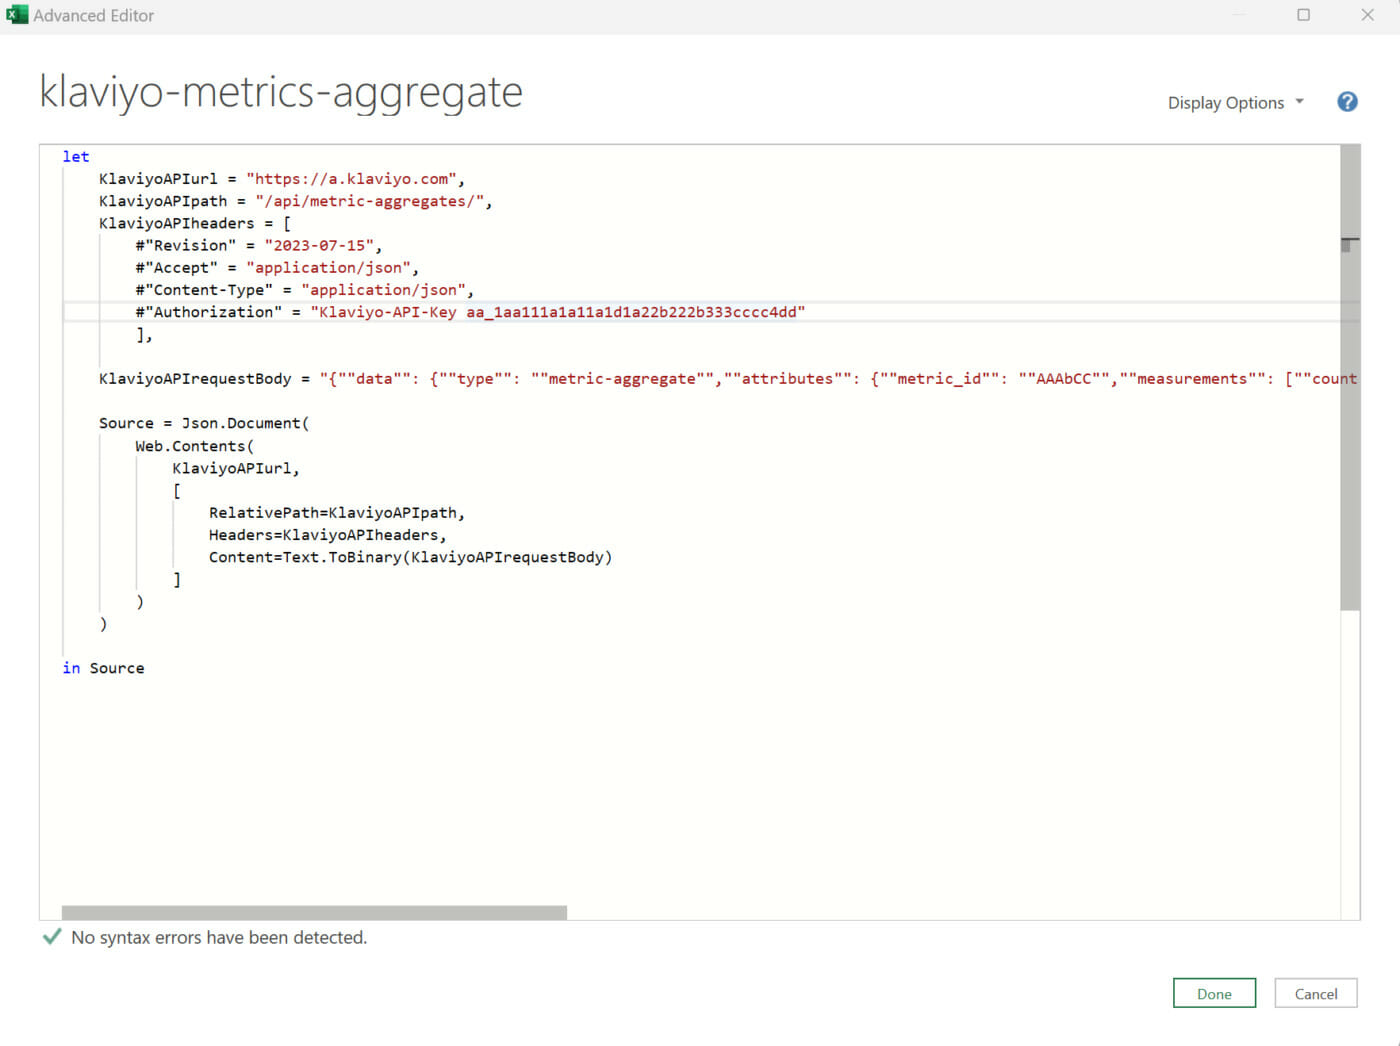
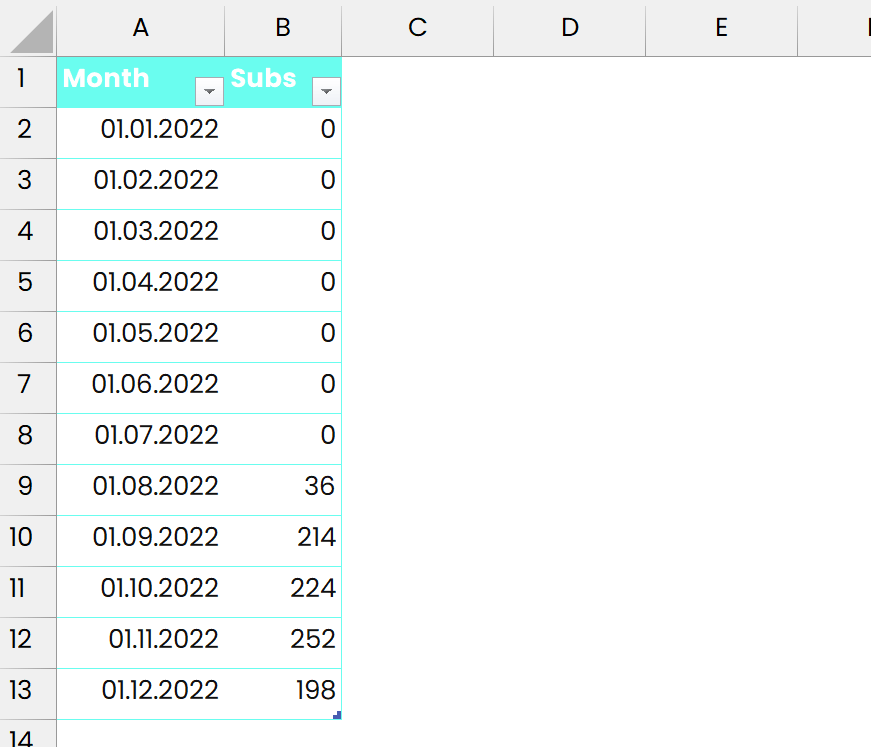
Don’t forget to insert your own API key accordingly and enter your metric ID in the body. In my example I decided to use a monthly listing of new subscribers.
4 | Transform the Klaviyo API response
As response Klaviyo provides a really horribly structured JSON document, which should look like this for you:
Your next job is to navigate the JSON document (by clicking on record and list links) and build a usable table from the various objects.
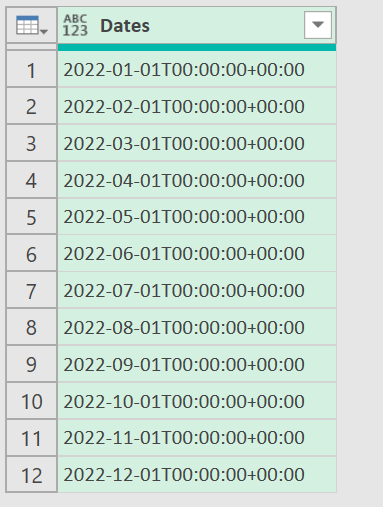
In my case – the monthly subscriber report – I started by completely expanding the dates for the monthly report table:
(M-Code)
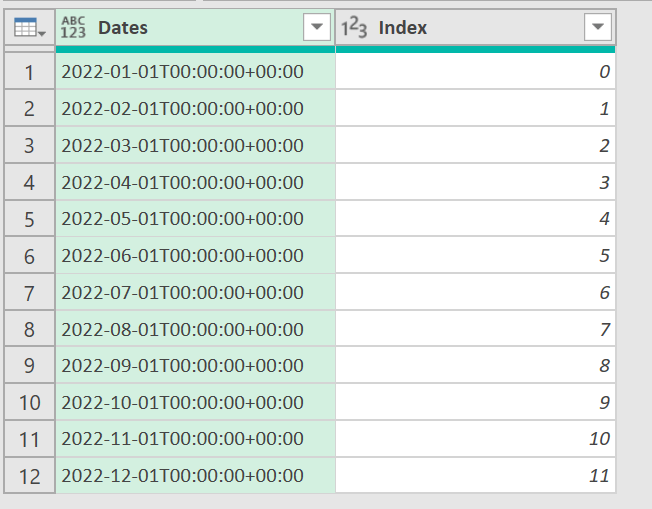
=Table.FromList(Source[data][attributes][dates], Splitter.SplitByNothing(), null, null, ExtraValues.Error)The I added an index columns to the expanded dates table / list:
(M-Code)
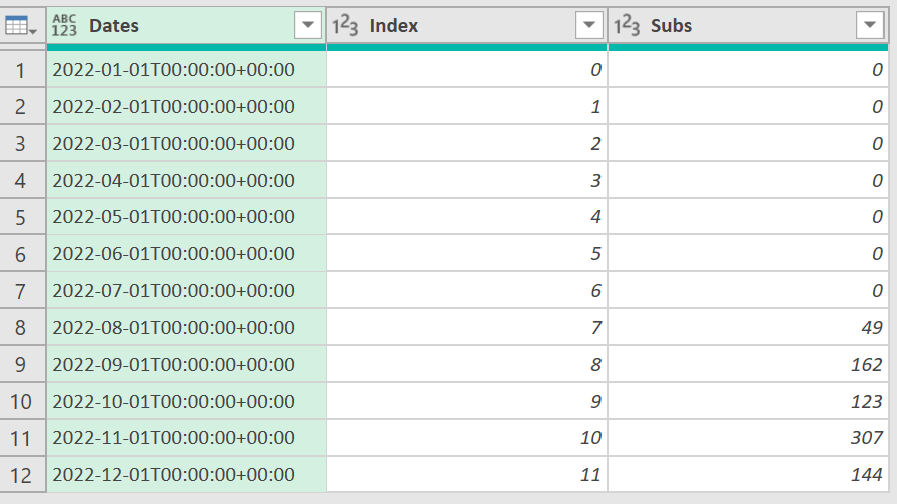
=Table.AddIndexColumn(expanded_dates, "Index", 0, 1, Int64.Type)Then I extracted the corresponding figures from the data (subscribers) object based on the index column and added them as the next column right next to the dates and index columns.
(M-Code)
=Table.AddColumn(ObjectIndex, "Subs", each Source[data][attributes][data]{0}[measurements][count]{[Index]}, Int64.Type)The remainder of work goes into things like formatting the date values and removing unwanted helper columns from the table. After clicking Close & Load in the top left I get a pretty neat Excel table which I can then use in my reports and dashboards.
5 | Happy Reporting
Now you have a solid data base and can use the Klaviyo table in Excel or Power Bi for tables and graphs. Accordingly: Happy Reporting.
Trouble with Klaviyo Report Automation?
If you have any problems with automating your reports related to Klaviyo, feel free to leave a comment. Should you need quick help, check out https://thebigc-agency.de. The solution was provided by THE BIG C Agency from a real life project. The agency specializes in data analysis and deployment for startups and SMEs, among others.

[…] ein GA4-HTTP-Request von meiner Website. Der Request, den das Skript beim Aufruf der Unterseite Klaviyo API Power Bi And Excel Connect (Power Query) durchführt sieht wie folgt […]